A few months back Microsoft released a free charting control for .NET. You can download the charting control and the plugin for VS2008 at the following links:
- Charting Control: http://www.microsoft.com/downloads/details.aspx?FamilyID=130f7986-bf49-4fe5-9ca8-910ae6ea442c&DisplayLang=en
- VS2008 Plugin: http://www.microsoft.com/downloads/details.aspx?familyid=1D69CE13-E1E5-4315-825C-F14D33A303E9&displaylang=en
Once these two packages are installed, we can go ahead and start creating our first charting project. For this project, we will create a pie chart illustrating the amount of customers grouped by region using the AdventureWorks sample database for SQL Server 2005. The AdventureWorks sample database can be downloaded freely here:
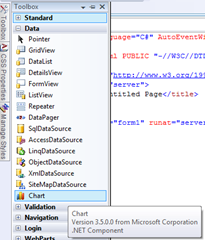
Fire up VS2008 and you should see a new item in your toolbox under the data heading:
Go ahead and drag a chart control onto the page and we will begin designing our chart. For this demo, we will be creating a 3-D pie chart.
Let’s also drag a SqlDataSource control onto the page. Configure it to connect to the AdventureWorks database and to issue the following SELECT query:
[code language=’sql’]
SELECT Sales.SalesTerritory.Name AS RegionName, COUNT(Sales.Customer.TerritoryID) AS CustomerCount
FROM Sales.SalesTerritory INNER JOIN Sales.Customer ON Sales.SalesTerritory.TerritoryID = Sales.Customer.TerritoryID
WHERE (Sales.SalesTerritory.CountryRegionCode = ‘US’) GROUP BY Sales.Customer.TerritoryID, Sales.SalesTerritory.Name
[/code]
This query will return all US based territories along with the total number of customers belonging to each.
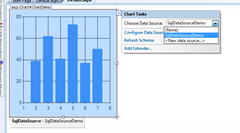
We can then configure the chart to use the SqlDataSource as shown in the picture below:
Now that the data source has been configured and attached to the chart, we can begin configuring the chart itself.
First let’s set the width of the chart to 800 pixels and the height of the chart to 600 pixels. These properties can be found on the Chart control itself. Let’s also set the DataSourceID property to the data source that we created earlier on the page.
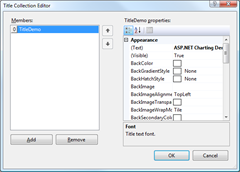
Let’s give the chart a title. To do this, we can modify the Titles collection and edit the (Text) property. You can modify font size and family here as well as lots of other properties which we won’t cover.
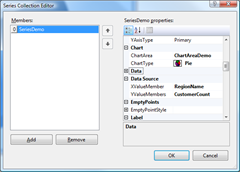
Time to change the chart into a pie chart and set up how to display the data from our data source. To do this, edit the chart’s Series collection. First, set the ChartType to Pie. Then, we can set the Data Source’s XValueMember and YValueMembers to RegionName and CustomerCount respectively. If these values do not appear in the DropDownList, just go ahead and type them in. Also go ahead and set the property IsValueShownAsLabel to True and the PieLabelStyle to Outside. This will show a line pointing to the pie slice with a label containing the number of customers for that region. Since the region name will be included in the legend that we will create, I think it is appropriate to show the customer count here.
Let’s also create a legend for this chart. To do so, modify the Legends collection and add a new legend. This should automatically hook the legend up to the series that we previously configured. If it doesn’t, you can re-open that series and set the Legend property appropriately.
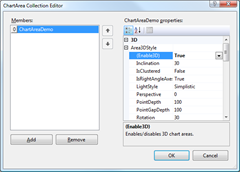
Next, let’s make the chart 3-D. Modify the ChartAreas collection and set the (Enable3D) property to True beneath the Area3DStyle section.
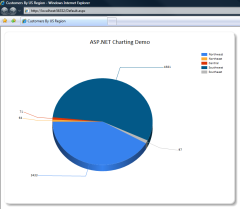
You can now build and run your project. If all has gone well, you should see something like the following in your web browser:
Your source code should look similar to what is shown below:
[code language=’xml’]
<%@ Page Language="C#" AutoEventWireup="true" CodeBehind="Default.aspx.cs" Inherits="ChartingDemo._Default" %>
<%@ Register Assembly="System.Web.DataVisualization, Version=3.5.0.0, Culture=neutral, PublicKeyToken=31bf3856ad364e35"
Namespace="System.Web.UI.DataVisualization.Charting" TagPrefix="asp" %>
